What we have gathered…
Levels of accessibility
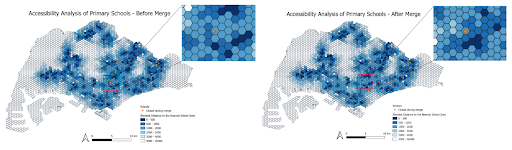
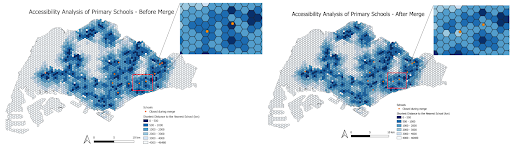
The level of accessibility for affected primary schools decreased in general. This is because the students attending the affected primary school or would be , now have to travel a relatively longer distance to the newly merged schools.
Before merge
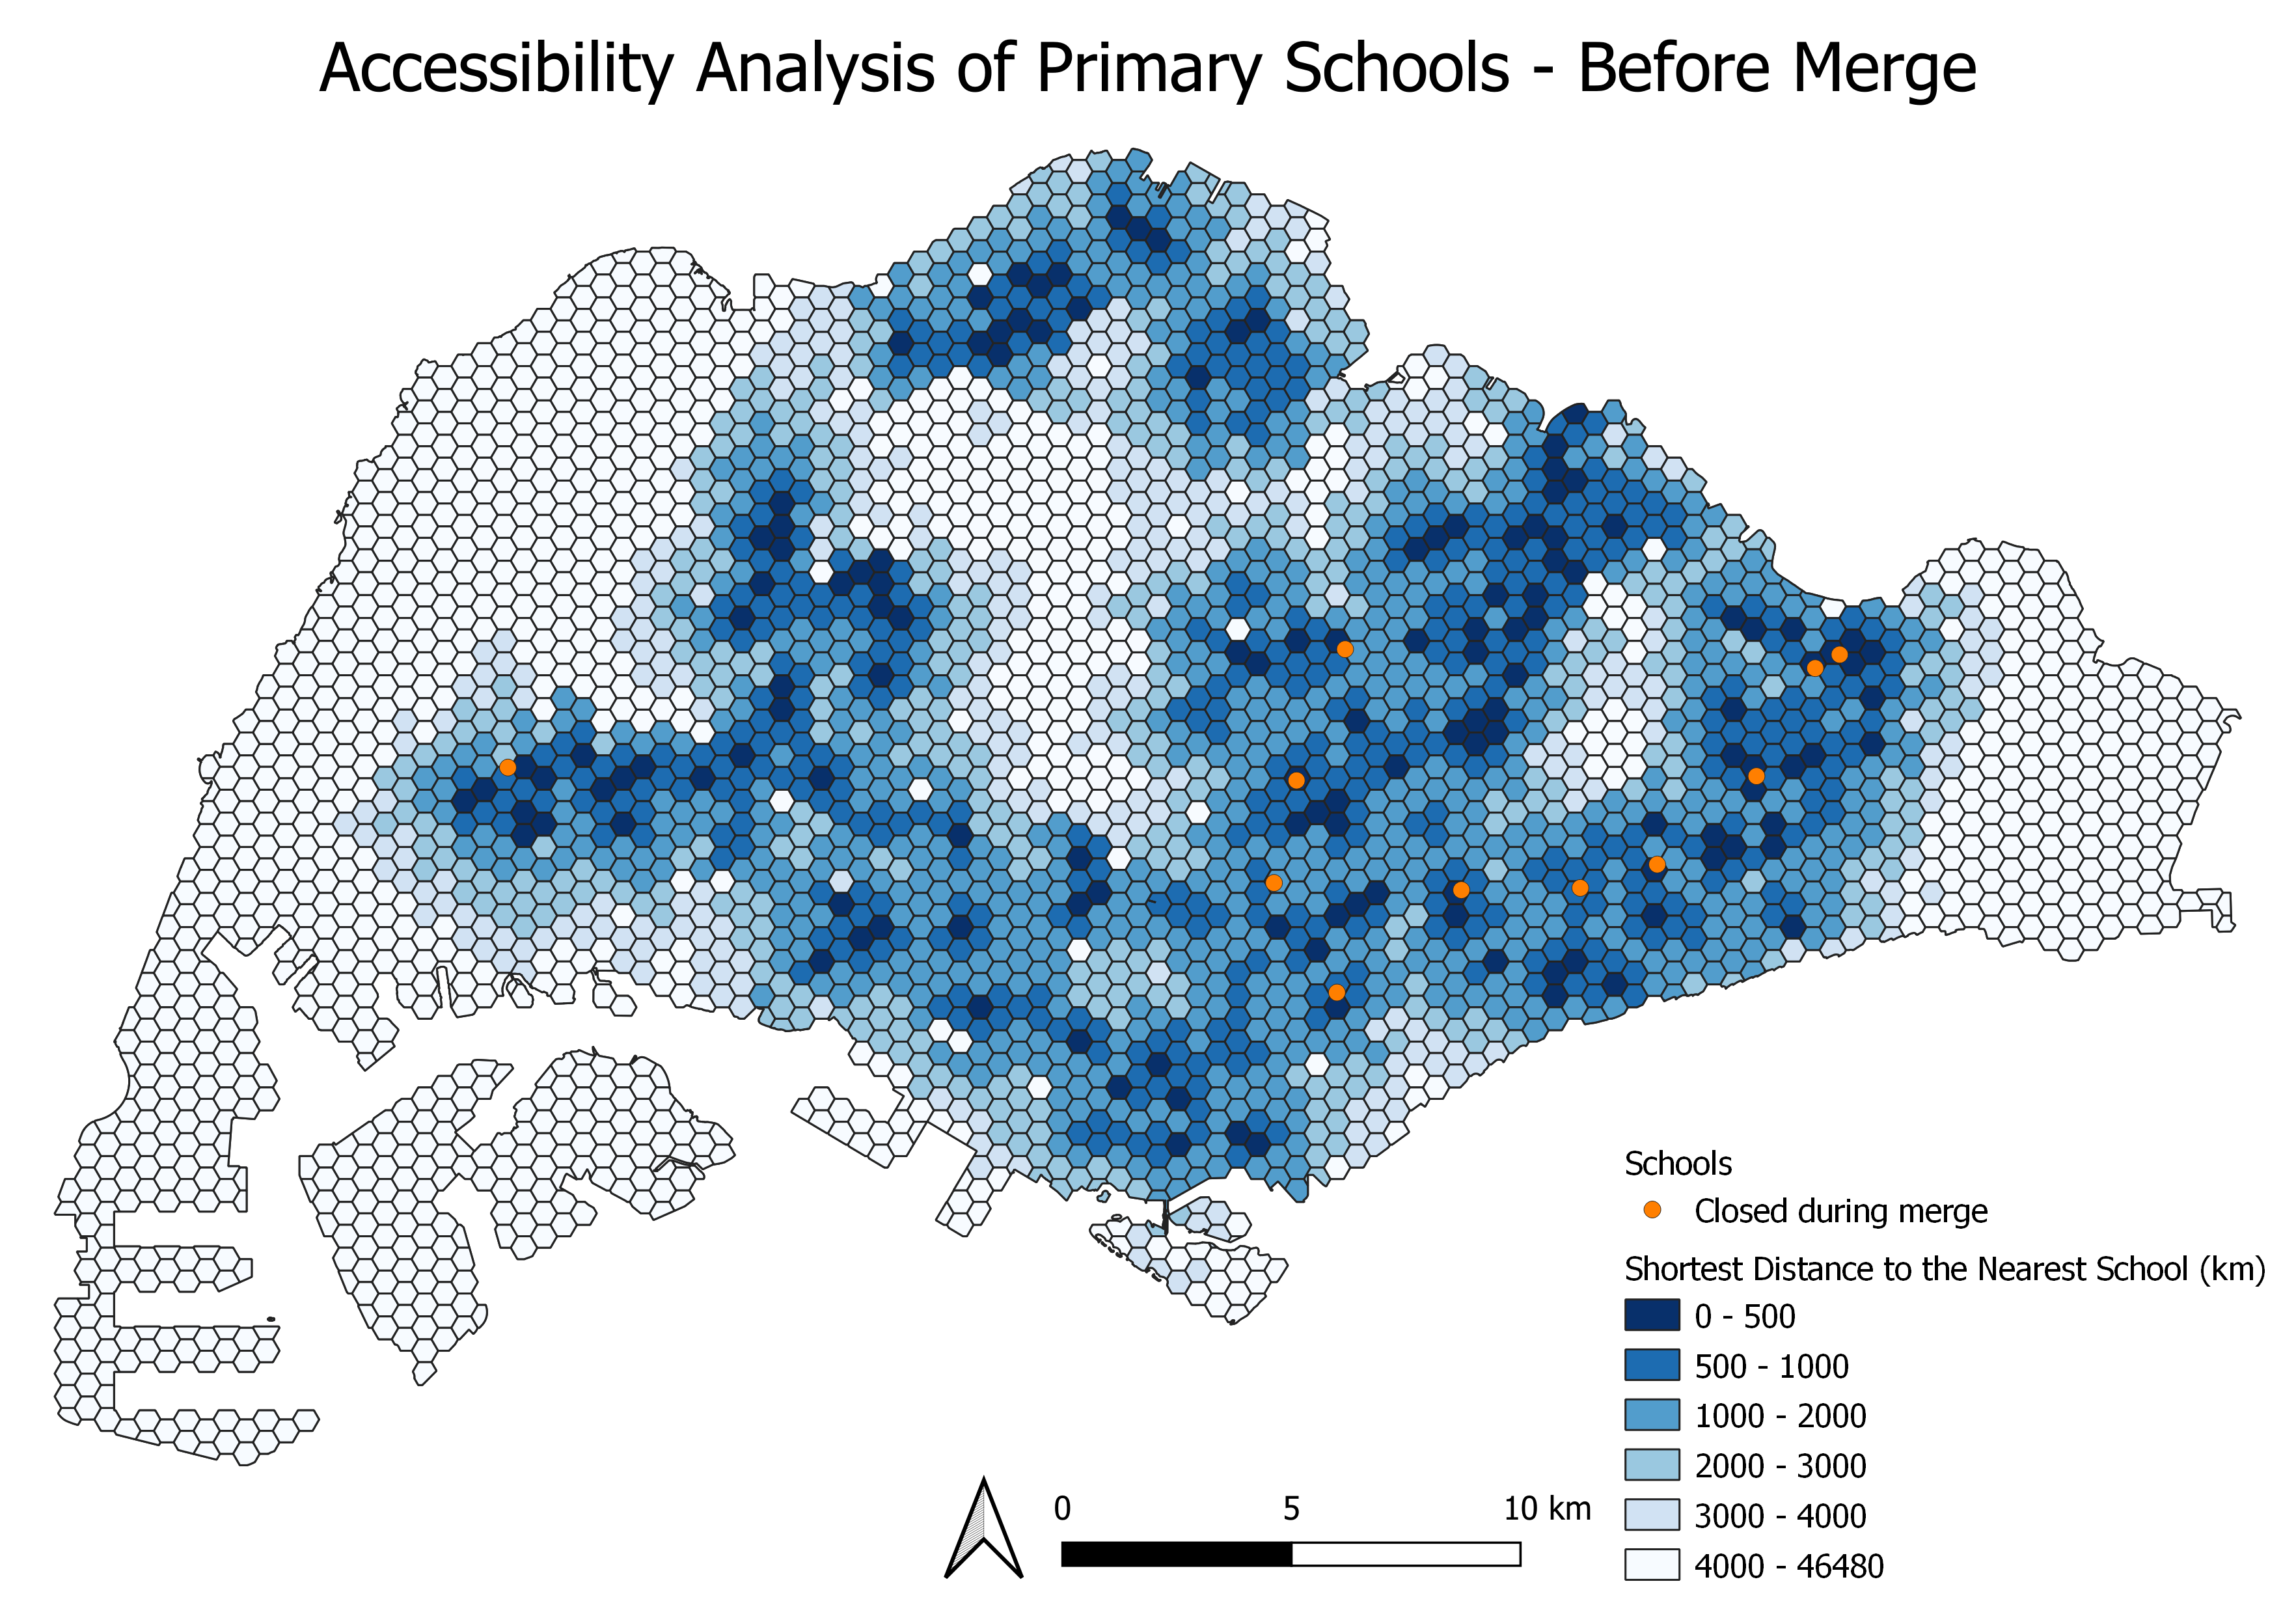
This map highlights the general accessibility to the schools in 2019. The most dense areas reveal the high level of accessibility that is less than 500m. We observed that the schools closest to the residents are saturated in the Eastern and South-Eastern parts of Singapore as we will see in the demographic analysis, where the majority of the student demographic reside in these areas.
High level of accessibility to schools for students in the saturated regions mean a high spatial inequality as they have the privilege of being less than 500m away from the school where it is convenient and able to save on transportation fees.
However, low level of accessibility means that students have to travel more than 2km to school do not get to enjoy the same privileges. They need to sacrifice some sleep to catch the public transport on time to get to school, or their parents have to drive them, which indirectly causes the rise of living expenses (fuel).
Histogram to reveal the distribution frequency of students near schools (before merge)
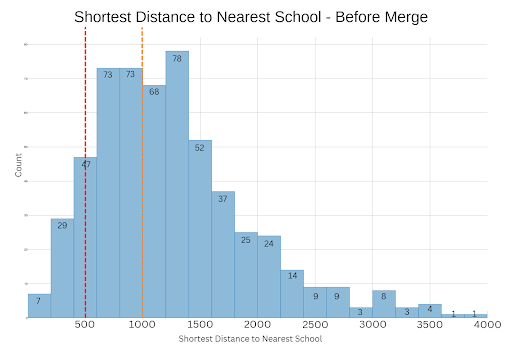
This histogram shows the spread of shortest distances in a 2km buffer region around the closing schools before the mergers. We can see that there are a higher number of hexagons that are within 500m to 1km walking distance of the schools
After merge
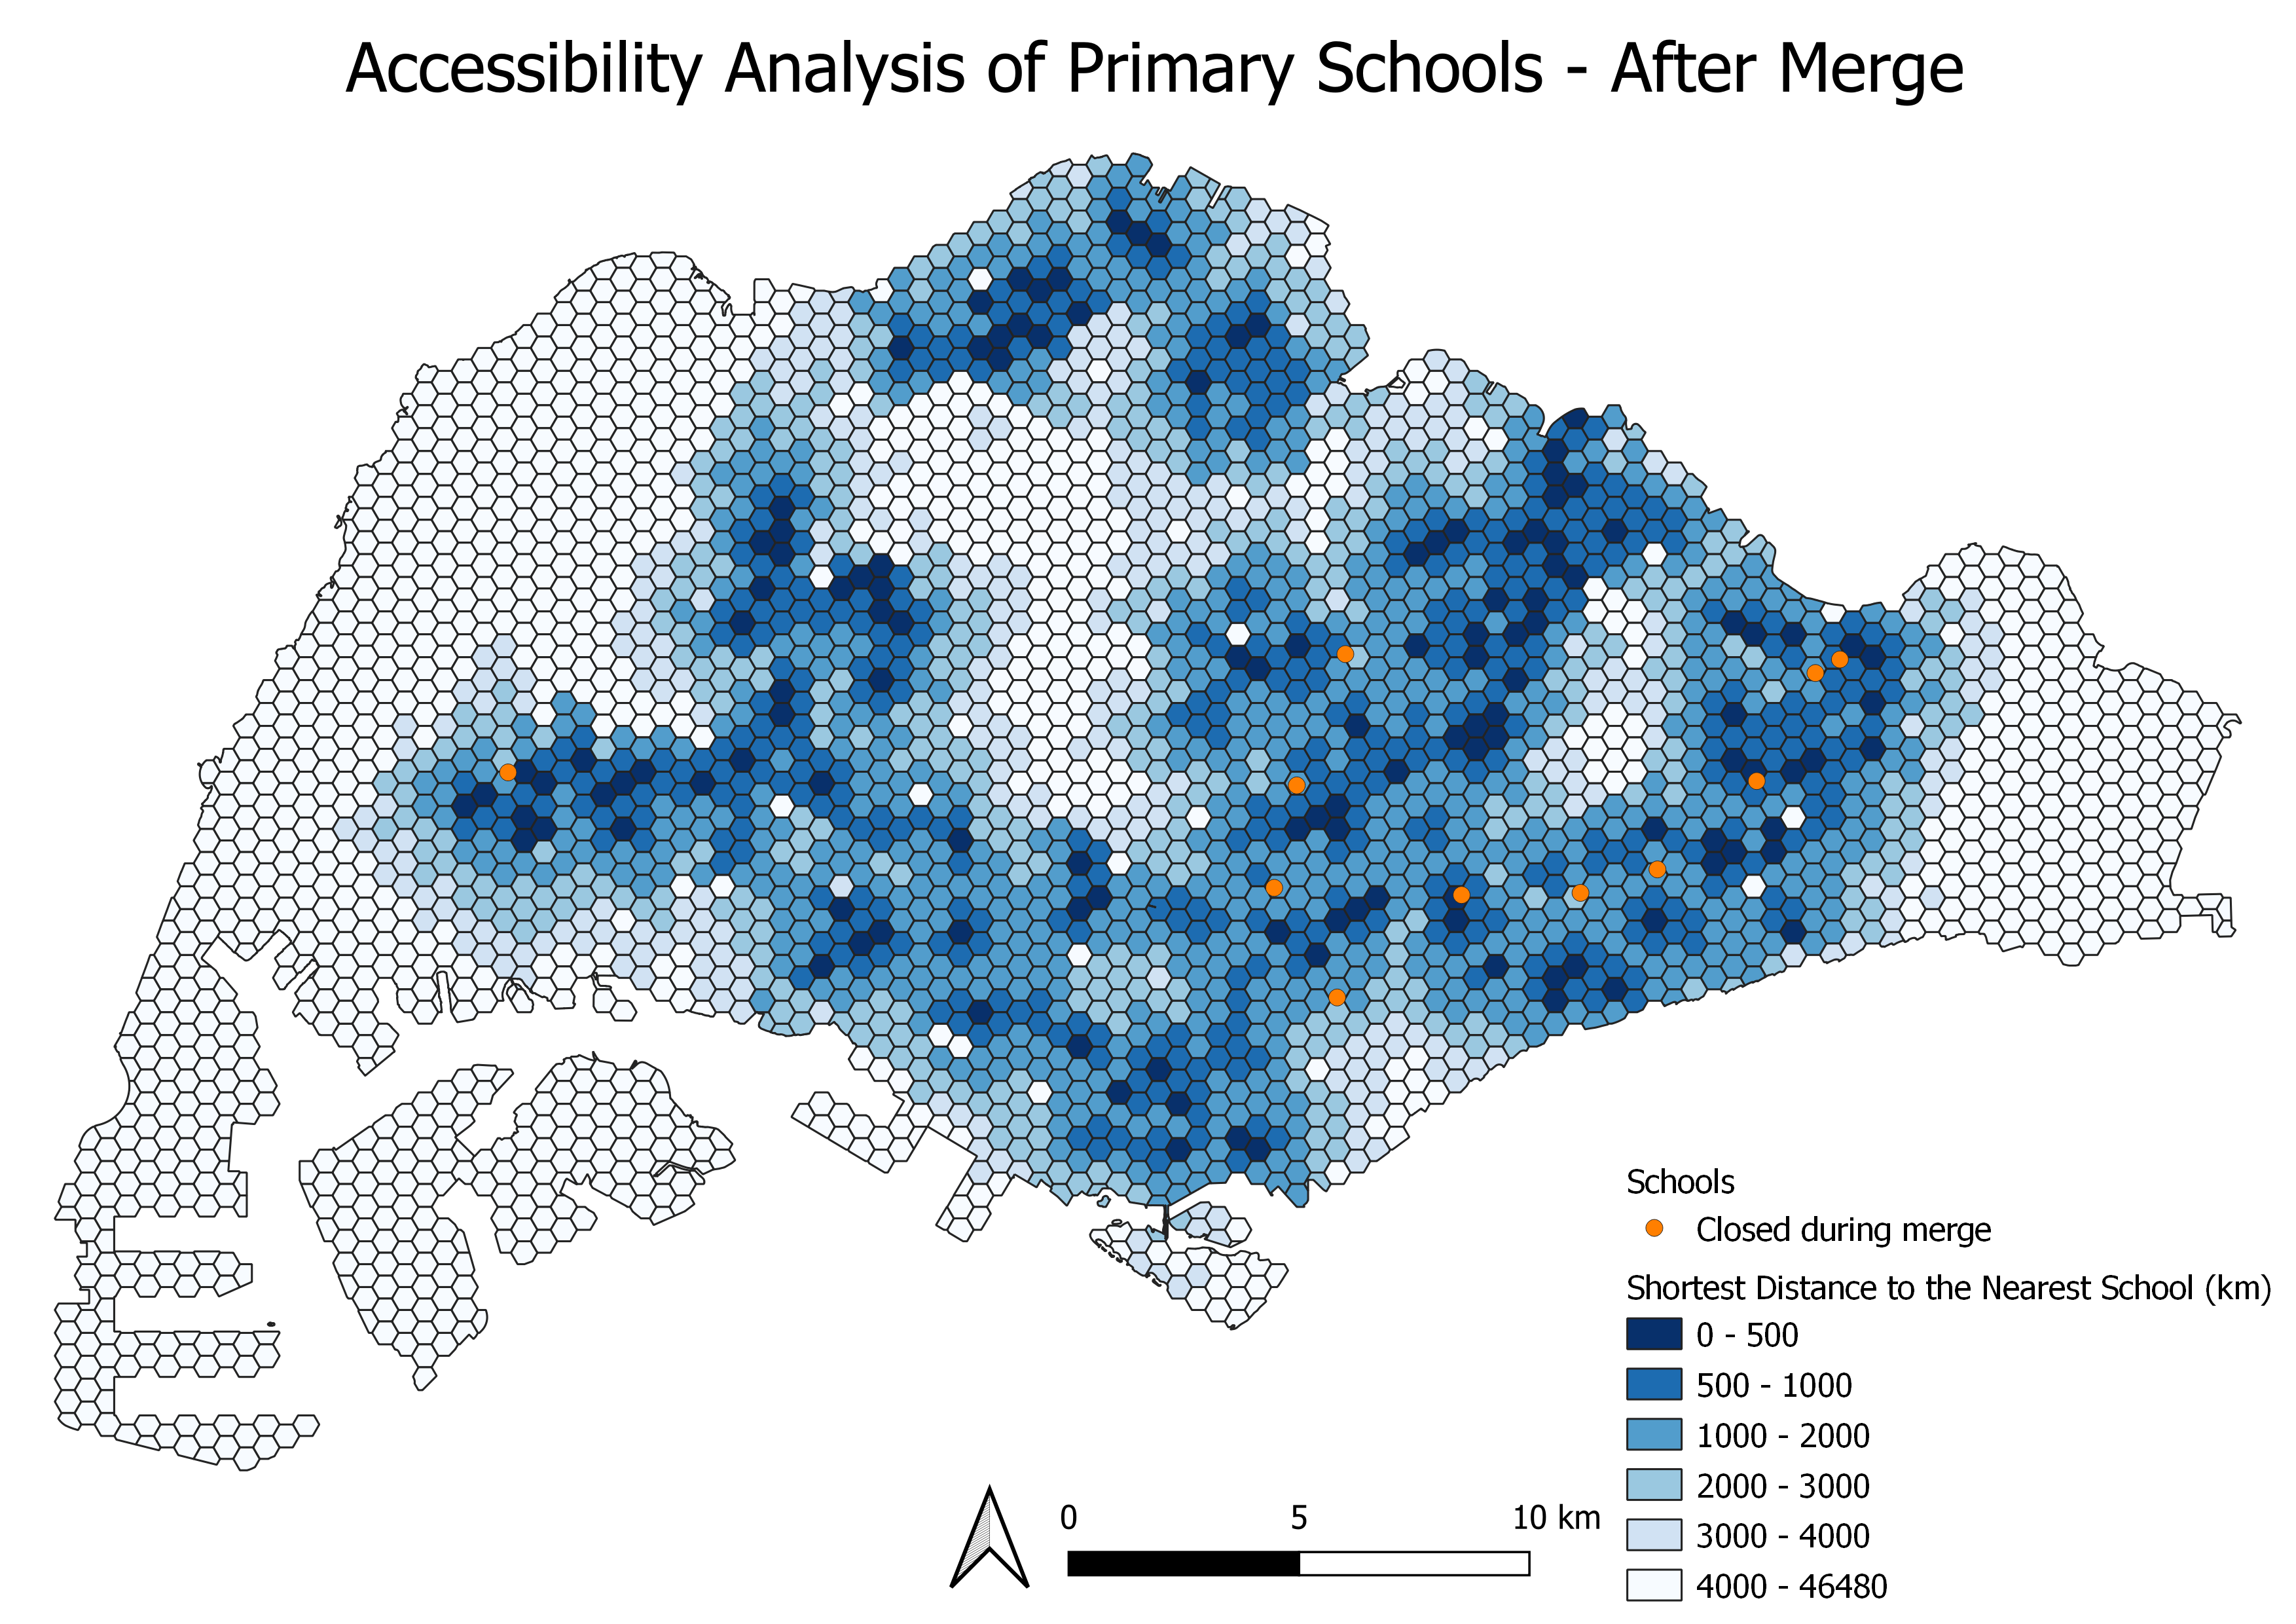
This map is a projection of the accessibility to schools in 2025 when only 180 schools are opened. The merge has the largest impact on students living closest to the closed schools. Before the merge, they had high level of accessibility to them. But in the future, they have to be re-allocated to the 2nd or 3rd closest schools surrounding where they live which could be slightly more than 500m away.
Though some are re-allocated to a slightly further school, it might have better facilities and environment for the students to enhance their learning experiences to benefit them holistically.
In conclusion, the impact of the merge brings more pros and cons to the students. The intermingling with students from different socio-economic background improves their social capital, those who were supposedly planning to go for the school closest, but could not due to the merge, can receive even better academic resources from other schools and the exposure to wider range of CCAs to meet their interests and talents definitely bring more positive impact than negatives from the low level of accessibility.
Histogram to reveal the distribution frequency of students near schools (after merge)
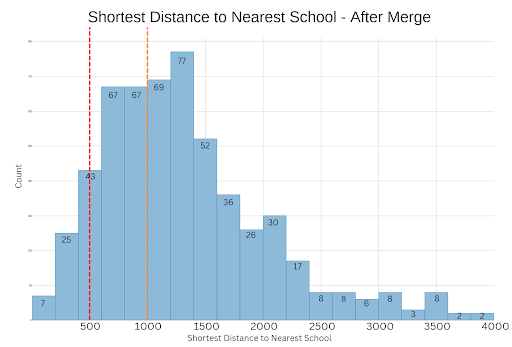
This histogram shows the spread of shortest distances in a 2km buffer region around the closing schools after the mergers. The students who attended these schools previously now have to travel to other schools. We can see that the number of hexagons that are within 500m to 1km walking distance of the schools has decreased due to the school closures. Walking accessibility has decreased for those who were living within 1 km walking distance of the closed schools.
Comparisons of before & after merge
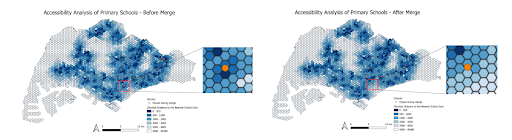
Zoomed in on Stamford Primary School for comparison analysis. Before the merge, most of the residentials near the school had the shortest distance of 0-2000 km to the nearest school. However, after the merge, most of the residential near the school now has the shortest distance of 1000-3000 km to the nearest primary school.
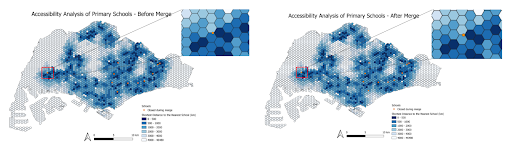
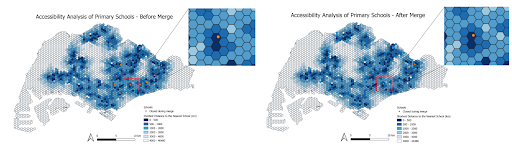
Zoomed in on Pioneer Primary School. There is only one hexagon whose colour is lighter after the merge, before the merge, that area had the shortest distance of 500-1000 km to the nearest school. However, after the merge, that area now has the shortest distance of 1000-2000 km to the nearest primary school.
Zoomed in on Da Qiao Primary School. There are 4 hexagons which are nearest to the school that have changed to a lighter colour after the merge. Before the merge, the 4 hexagons had the shortest distance of around 0-2000 km to the nearest school. However, after the merge, the 4 hexagons now has the shortest distance of around 500-3000 km to the nearest primary school.
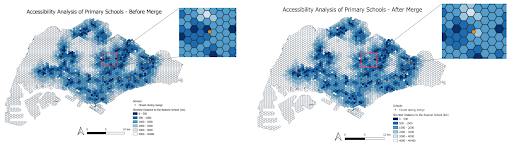
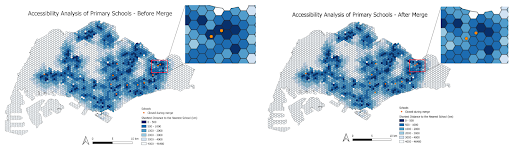
Zoomed in on Guangyang Primary School. The residentials near the south side of Guangyang primary school are not affected by the merge, as seen from the unchanged colour of the south side of the hexagons near the school. The hexagons which are very near to the school and are at the west side of the school have changed the colour after the merge. Before the merge, those hexagons had the shortest distance of around 0-2000 km to the nearest school. However, after the merge, those hexagons now have the shortest distance of around 1000-3000 km to the nearest primary school.
Zoomed in on Balestier Hill Primary School. At the west side of the school, after the merge, the shortest distance has increased from 500-2000 km to 1000-3000 km to the nearest school. At the east and east-south sides of the school, after the merge, the shortest distance has decreased from 500-2000 km to 0-1000 km to the nearest school.
For the hexagons which are very close to the school, their shortest distance to the nearest school has decreased after the merge, which means the residentials at those areas are more accessible to the nearest primary school after Balestier Hill Primary School closed.
Zoomed in on Macpherson Primary School. Interestingly, the colours of the hexagons near the school have not changed after the merge of the school, this means that for the residentials near this school, the shortest distance to the nearest school has stayed relatively the same after the merge.
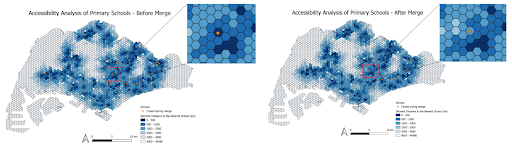
Zoomed in on Loyang Primary School and Coral Primary School. The two hexagons which the two schools are located at, and another hexagon which is at the east-south side of the Loyang primary school, have changed colour after the merge. For those 3 hexagons,, the shortest distance has increased from 0-500 km to 500-2000 km to the nearest school.
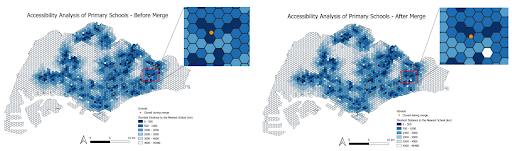
Zoomed in on East View Primary School. For the hexagon on the south side of the school, its shortest distance to the nearest school has increased from 0-500 km to 500-1000 km after the merge of the school. There is a hexagon on the east-south side of the school whose colour has changed to white, the shortest distance to the nearest school has increased from 500-1000 km to 4000-46480 km after the merge of the school.
Zoomed in on Eunos Primary School and East Coast Primary School. Mainly the hexagons surrounding the two schools have changed the colours. Before the merge, those hexagons near the school had the shortest distance of 0-1000 km to the nearest school. However, after the merge, those hexagons near the school now have the shortest distance of 1000-3000 km to the nearest primary school.
Demographic analysis
Population distribution is an important decision-making factor to decide what school should be closed down for the merge. Hence, we will perform a demographic analysis to understand the severity of the impact on the volume of students potentially affected.
Impact on the current students; 5-9 years old
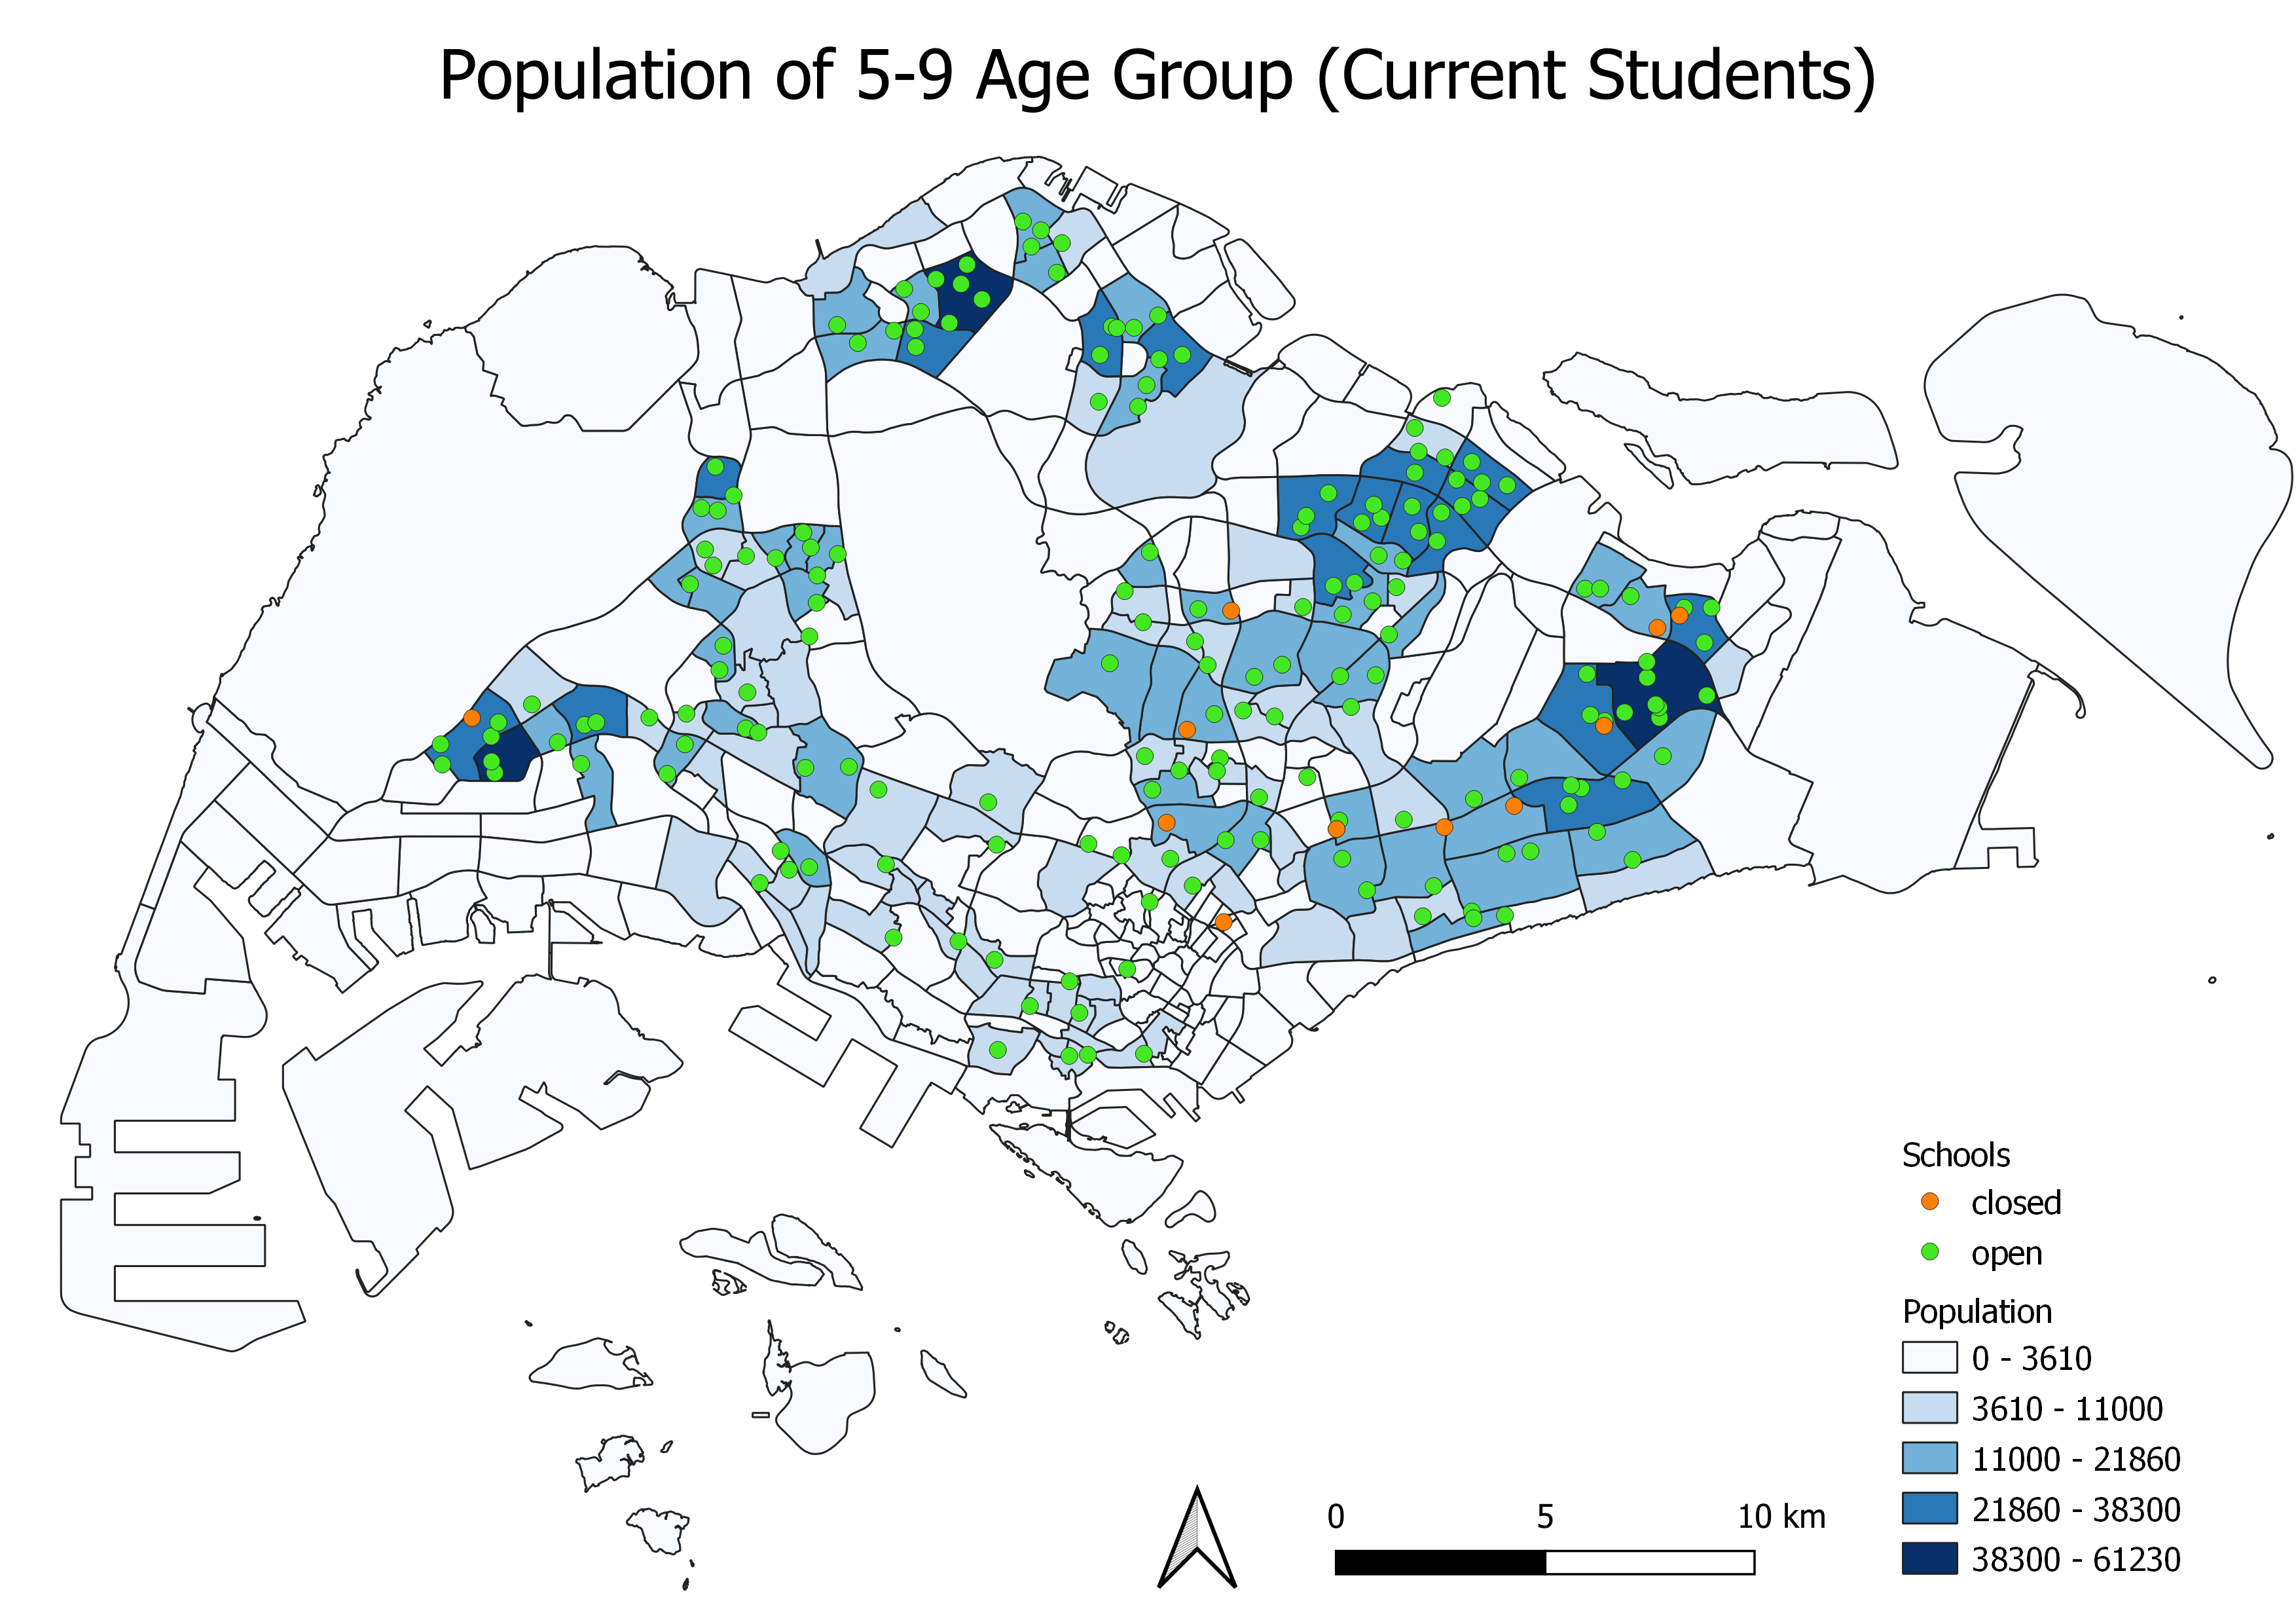
There is a high proportion of current primary school students living in the east, north and west subzones. One of the closed schools is close to the high population east subzone. Other schools in the region could become more crowded as the large population is now spread over a lesser number of schools.
Students between ages 5-6 , especially 6 years old, will face immediate impact from the merger. They will be allocated to the second nearest school that may be slightly more than 500m away which decreases accessibility level and convenience. As they settled into their current environment, the change in it will bring stress to them as they may not be able to cope with the sudden changes. They may face immense pressure to keep up with the other students which further affects their mental well-being. However, not all is bad as the new school environment may actually be better suited to their learning needs, and the alternative school may actually be slightly nearer or the same (500m) from where they live.
However, students between ages 7-9 will not experience this impact at all as they are the last batch of students in their current school.
Impact on the incoming students; 0-4 years old
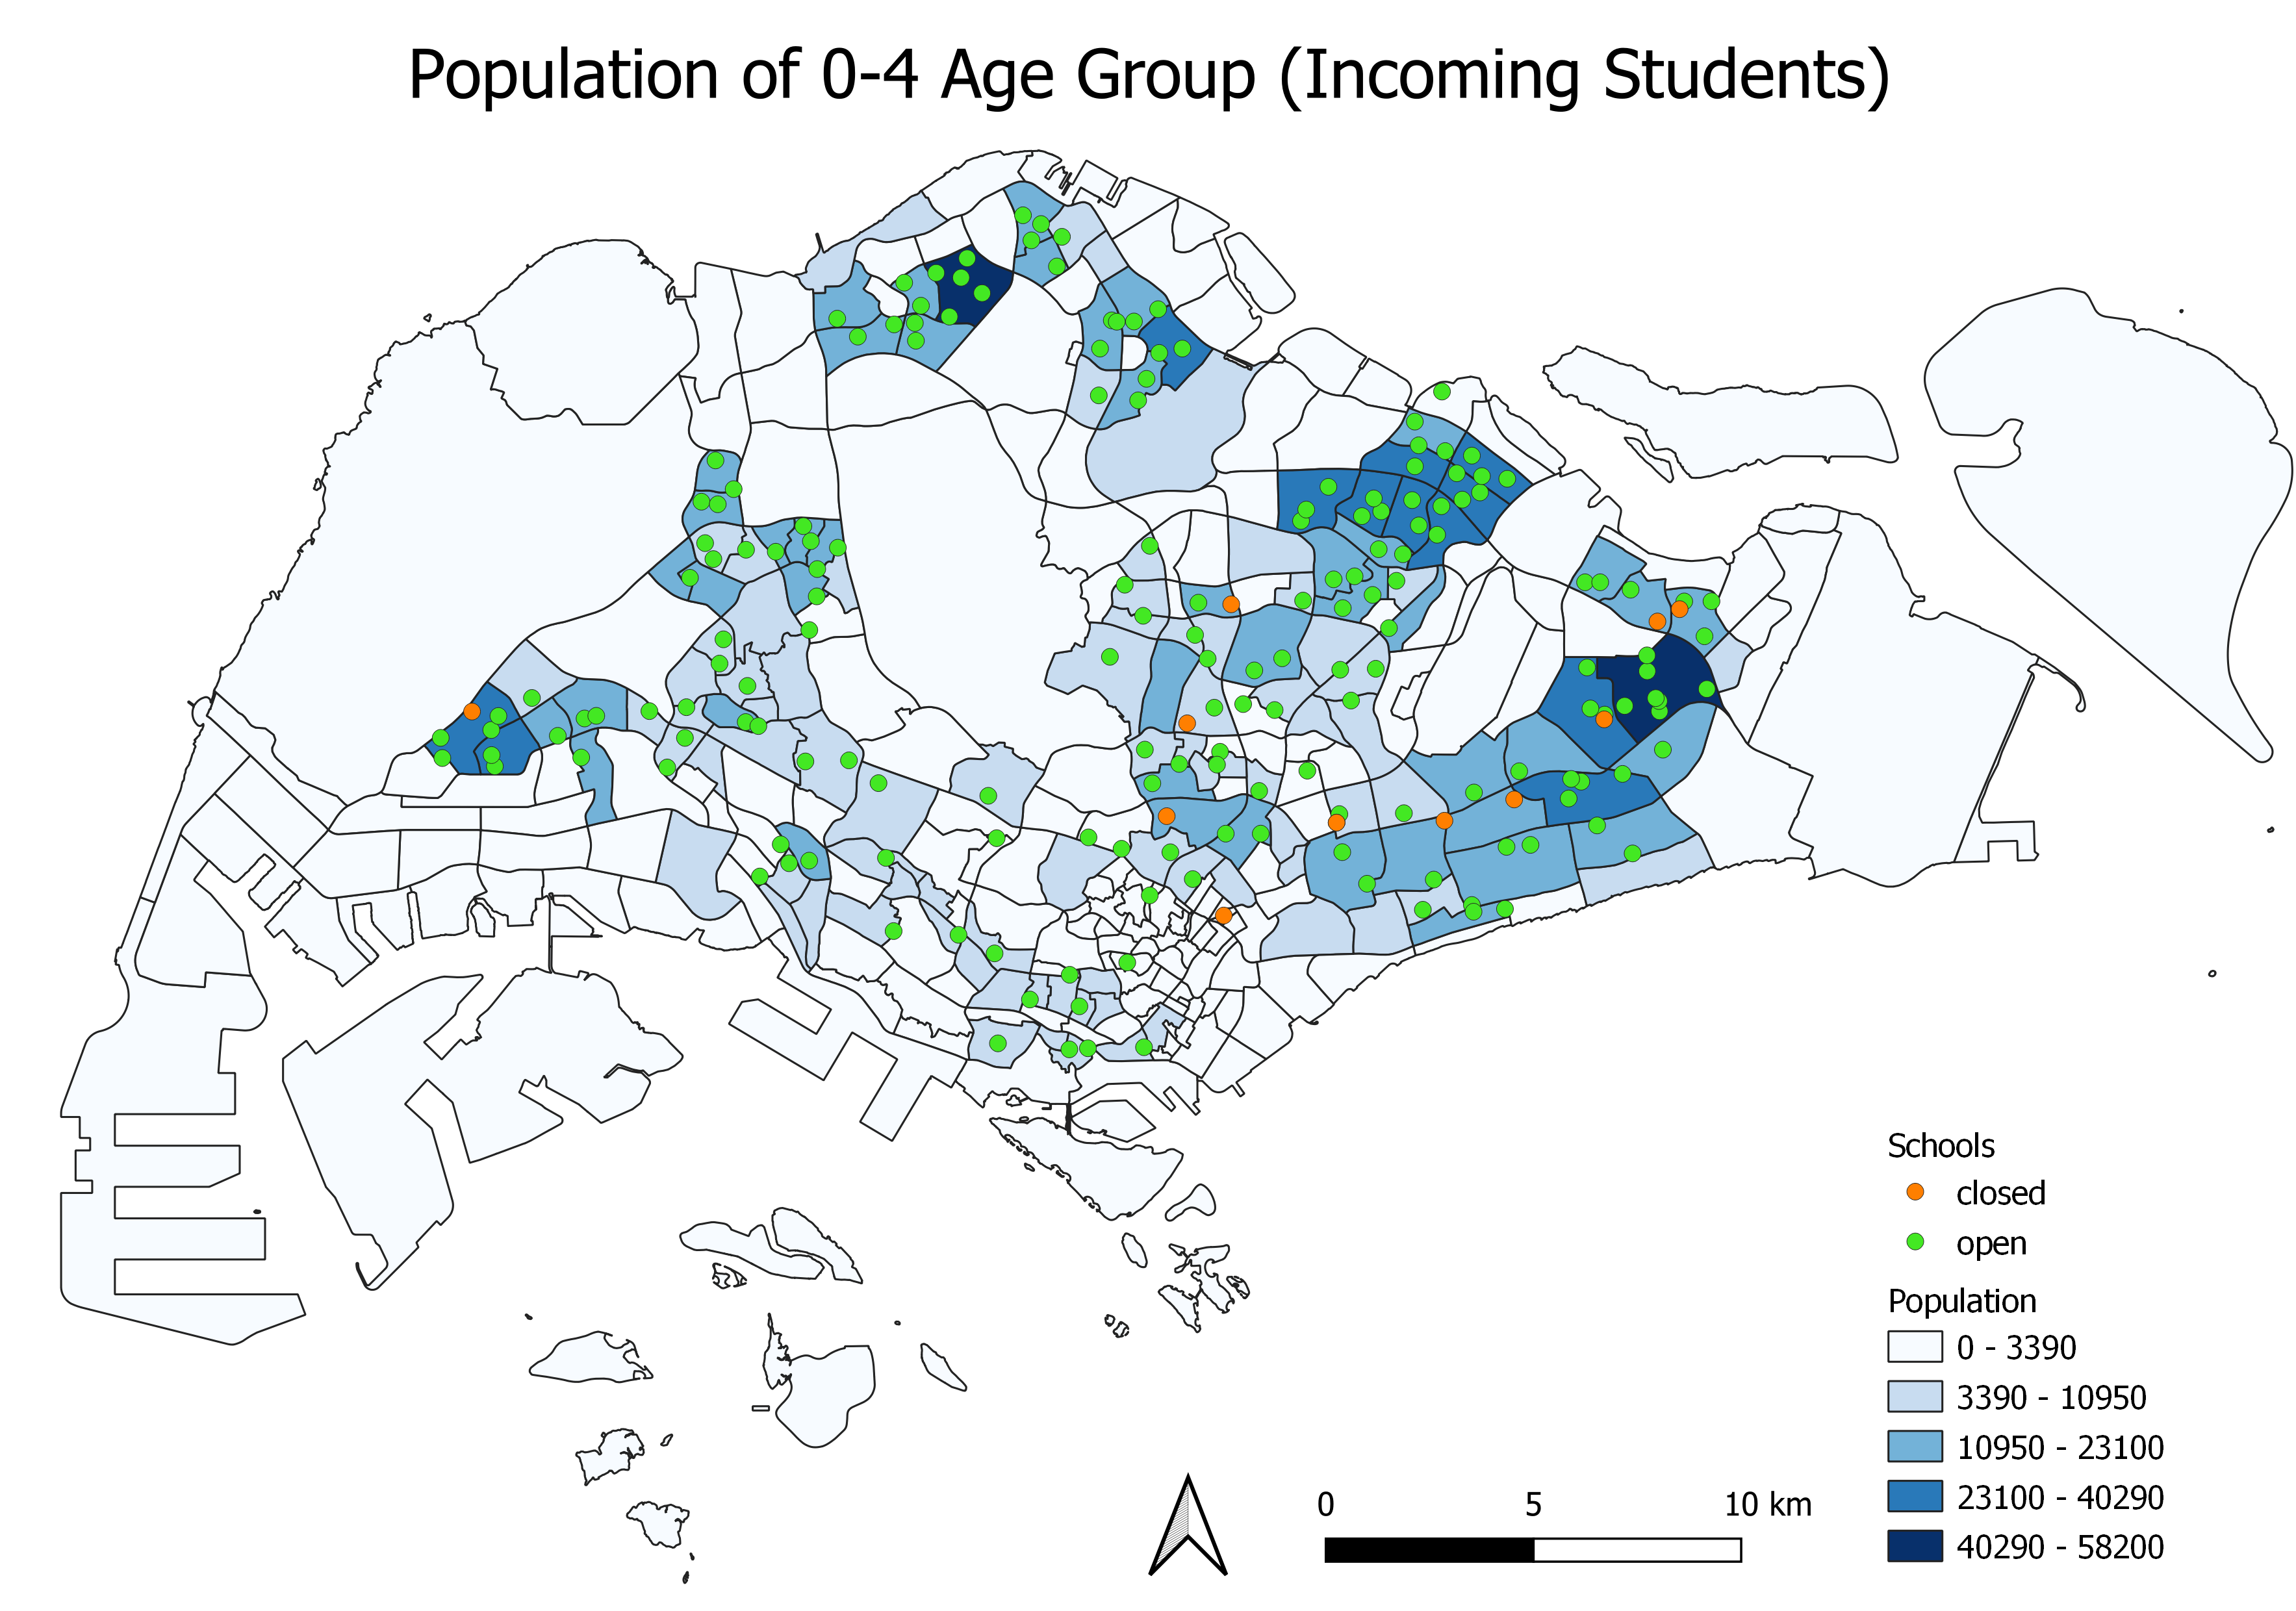
The incoming students for 2025 do not face the same impact. This is because some of them may not be affected by the distance as they live near the school or parents may have arranged the school bus service for them. However, we also recognized the fact that this will reduce level of accessibility for some students compared to attending the school before merger.
They are more likely to be cushioned from the social impact as parents will adequately prepare them for the expected environments in these schools. In fact, this group of students may tend to gain more from the merge schools due to the good resources and extensive CCAs, compared to attending the previously planned school.
Comparisons of 5-9 and 0-4 population distribution in different subzones
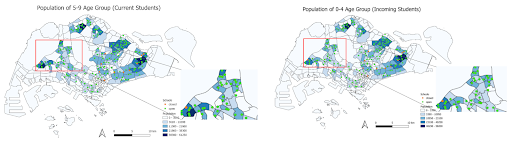
The subzone in the west has a lighter colour as compared to the choropleth map for 5-9 Age Group (Current Students), meaning that there are fewer incoming students than there are now. This justifies the government’s approach of closing the primary school in the west (Pioneer Primary).
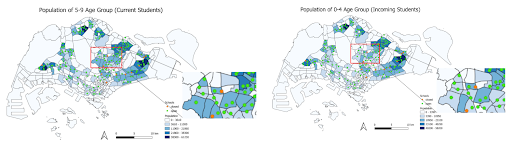
With comparison to the choropleth map for 5-9 Age Group (Current Students), the central subzones also have a lighter colour. The government could consider closing a school in this region in the future, if needed.