What steps did we take to get there?
An overview in visual
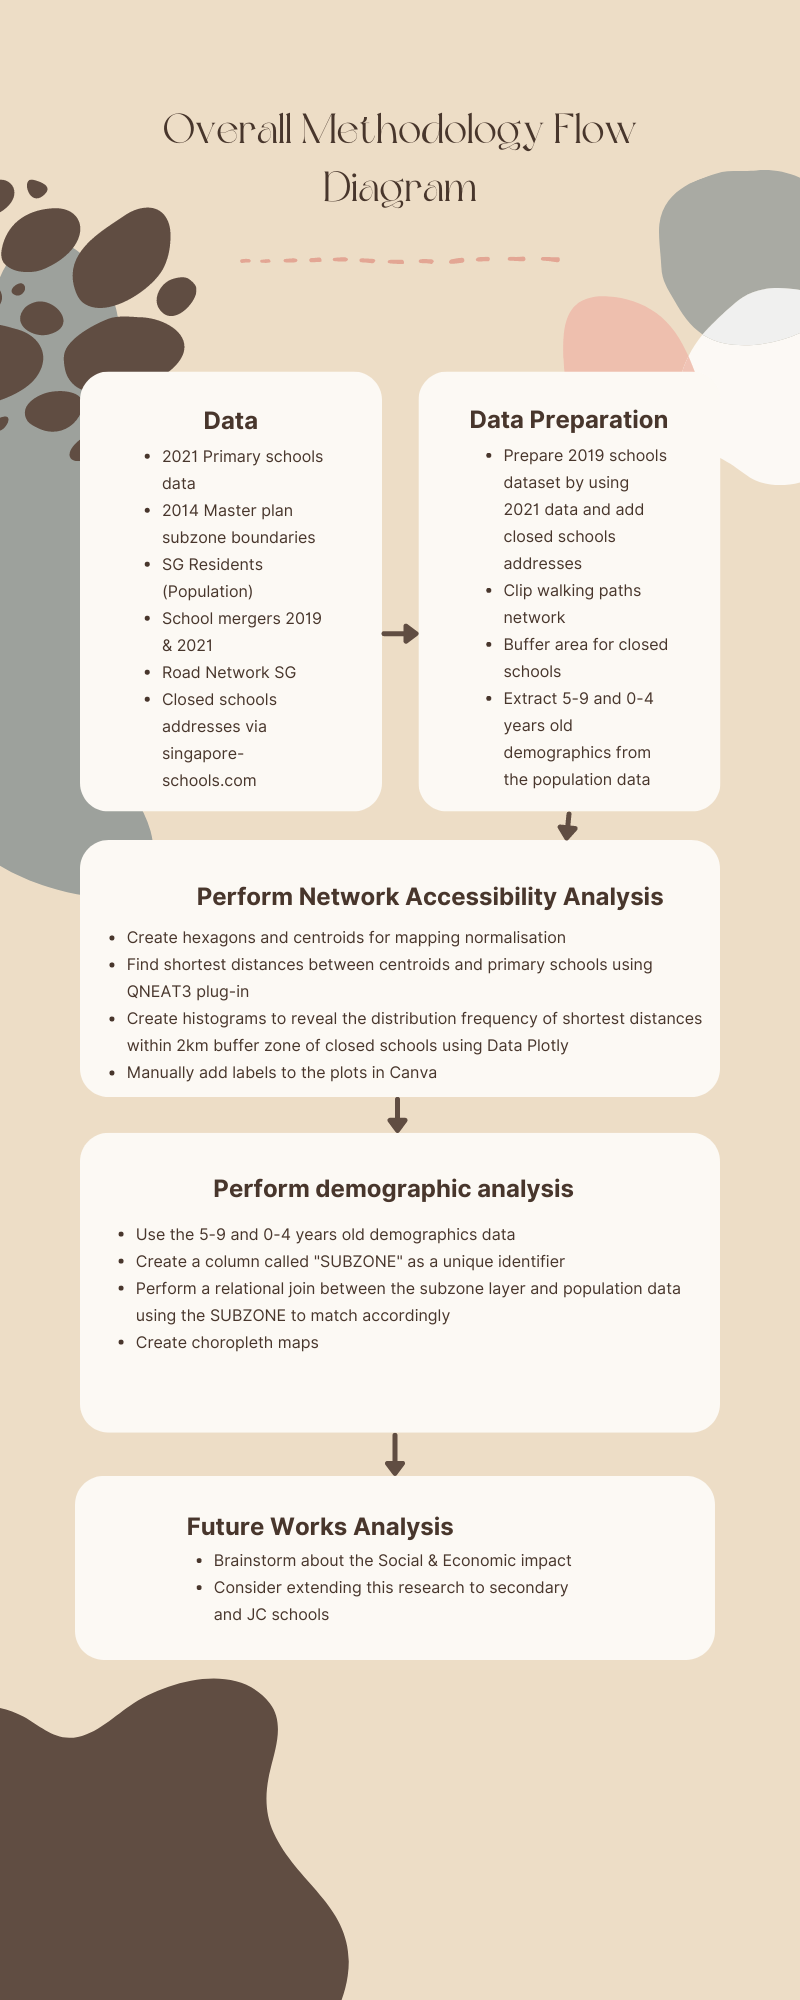
Data
The following data sets are used:
Data preparation
1. Preparing the 2019 Schools dataset
As the primary schools dataset was updated in 2021 to not include the schools closed through mergers, they need to be added back to the dataset to show schools which were open in 2019. A total of 7 schools were added, corresponding to the closed schools as announced in the 2019 MOE merger announcement. The names and address of these schools were manually added into the 2021 Primary Schools dataset, along with the mainlevel_code = "Primary". The old addresses of these closed schools were found from the website singapore-schools.com. Once all schools were added, only the Primary schools were filtered using mainlevel_code = "Primary".
An additional column called "Status" was created. This "status" column will be useful in colouring the school icons on the map according to their status in 2025.
If the schools were involved in the merges and will be closed as of 2025, they are marked "closed"
If the schools were involved in the merges but would remain open as of 2025, they are marked "open"
All other schools are marked "not affected"
Once the 191 primary schools dataset was ready, geocoding was done to determine their latitudes and longitudes using the Google API. All schools were found and a shapefile was created with 191 points.
2. Walking Paths network
As primary school children are young, we assume that they all walk to schools and do not travel long distances via car or public transport. Walking paths were extracted from OpenStreetMap Roads data by selecting all fclass except primary, secondary, tertiary, primary_link, secondary_link and tertiary_link. This would give the walking paths network.
The walking paths network was also clipped to the Singapore boundary by using the Master Plan 2014 subzone shapefile layer.
3. Buffer Area for Closed Schools
Our hypothesis was that students who lived around schools that would close by 2025 would be the most affected by the closures, as they would now have to travel further to reach the next nearest primary school. As MOE gives priority to children living within 2km of schools to attend the school, we decided to consider the changes in shortest distance travelled for regions within a 2km buffer area around each closed school.
The Buffer function under GeoProcessing Tools > Vector menu was used to build the 2km buffers. Each buffer used 100 segments.
These buffers are used to help create the histograms in the Analysis tab.
4. 2019 Population Data per subzone
The DB Manager is used to extract population data for the year 2019 with 2 data columns per Subzone - "Ages 5 to 9" and "Ages 0 to 4". Each column represents the number of current primary school students and incoming primary school students respectively for each subzone in the year 2019.
An additional SUBZONE_N column is also created in the population dataset, which is an uppercase version of the Subzone name that is available.
Network Accessibility Analysis
With the above data prepared, we now work on the Network Accessibility Analysis. We employ this method to identify spatial inequalities and analyse the merging impacts on current students and the future generations in 2025.
1. Creating hexagons and centroids for mapping normalisation
Using the Vector > Research Tools > Create Grid menu, we create hexagon grids within the Singapore Master Plan 2014 boundary of size 500. This excludes Pulau Ubin in the north east.
Once the hexagons are prepared, we use the Vector > Geometry Tools > Centroids menu to create centroids for each of the hexagons. These centroids will be the starting points when calculating the shortest distances from each region of Singapore to their nearest primary school.
2. Finding Shortest Distances between centroids and primary schools using QNEAT3 plug-in
Using the OD Matrix from layers as Table (m:n) function in the Processing Toolbox, we calculate the shortest distances from each hexagon centroid (start points) to all the 191 primary schools (end points). We then use the Execute SQL function to extract each hexagon centroid (start point), its shortest distance and the corresponding school (end point). This gives us the shortest distances from each region of Singapore to their nearest schools in 2019, when all schools were still open.
We repeat the same shortest distance calculation using the OD Matrix function, but excluding the 11 schools that would be closed by 2025. The compiled shortest distance table would show the shortest distances from each region of Singapore to their nearest schools in 2025, after the mergers are all completed.
Based on the distances, hexagon choropleth maps were created for before the mergers and after the mergers, as seen in the Analysis tab.
3. Histograms showing distribution of shortest distances within 2 km buffer zone of closed schools.
The shortest distance layers were clipped to only those hexagons which are in the 2km buffer region. This helps to narrow the histogram range down so that the relevant changes can be seen.
Histograms were created using Data Plotly and labels were manually added using Canva.
Demographic Analysis
We will perform our demographic analysis using Choropleth mapping to highlight the spatial distribution of 0-4 years old and 5-9 years old populations of Singapore within the MP14 Subzone Boundary.
Children who are aged 0 to 4 would eventually be in primary school by 2025, after all the school mergers. Hence, we can see how there is a change in the number of primary students per subzone by comparing the 2 choropleth maps seen in the analysis section.
The population dataset is joined with the subzone layer on the SUBZONE_N column. This allows us to create a choropleth map of the population distribution in Singapore in 2019. One choropleth map is created each for the current students and the incoming students.
Convert the POP2020.csv into an attribute table
Create a column called “SUBZONE” to be used as a unique identifier
Perform a relational join between the MP14 Subzone GIS layer and the POP2020 attribute layer
Create a Choropleth map to show the distribution of the two different demographics by filtering 0_4 and 5_9
Future Work
- Consider a deeper analysis on the paths that are contributing to longer students in 2025
- Consider extending to other main_level of schools
- Explore the social and economic effects of school mergers